PUBLICATION
PeakVizor: Visual Analytics of Peaks in Video Clickstreams from Massive Open Online Courses
Qing Chen, Yuanzhe Chen, Dongyu Liu, Conglei Shi, Yingcai Wu,and Huamin Qu
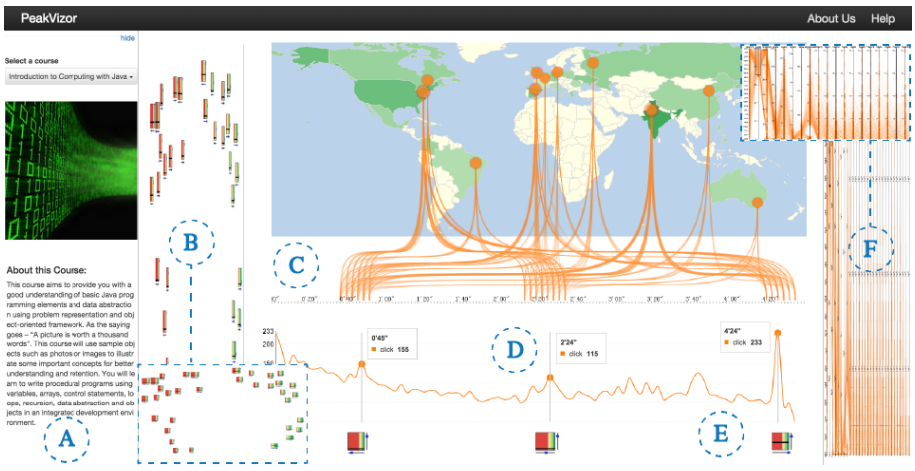
Abstract
Massive open online courses (MOOCs) aim to facilitate open-access and massive-participation education. These courses have attracted millions of learners recently. At present, most MOOC platforms record the web log data of learner interactions with course videos. Such large amounts of multivariate data pose a new challenge in terms of analyzing online learning behaviors. Previous studies have mainly focused on the aggregate behaviors of learners from a summative view; however, few attempts have been made to conduct a detailed analysis of such behaviors. To determine complex learning patterns in MOOC video interactions, this paper introduces a comprehensive visualization system called PeakVizor. This system enables course instructors and education experts to analyze the ``peaks” or the video segments that generate numerous clickstreams. The system features three views at different levels: the overview with glyphs to display valuable statistics regarding the peaks detected; the flow view to present spatio-temporal information regarding the peaks; and the correlation view to show the correlation between different learner groups and the peaks. Case studies and interviews conducted with domain experts have demonstrated the usefulness and effectiveness of PeakVizor, and new findings about learning behaviors in MOOC platforms have been reported.
