PUBLICATION
Visual Analysis of Set Relations in a Graph
Panpan Xu, Fan Du, Nan Cao, Conglei Shi, Hong Zhou, and Huamin Qu
Abstract
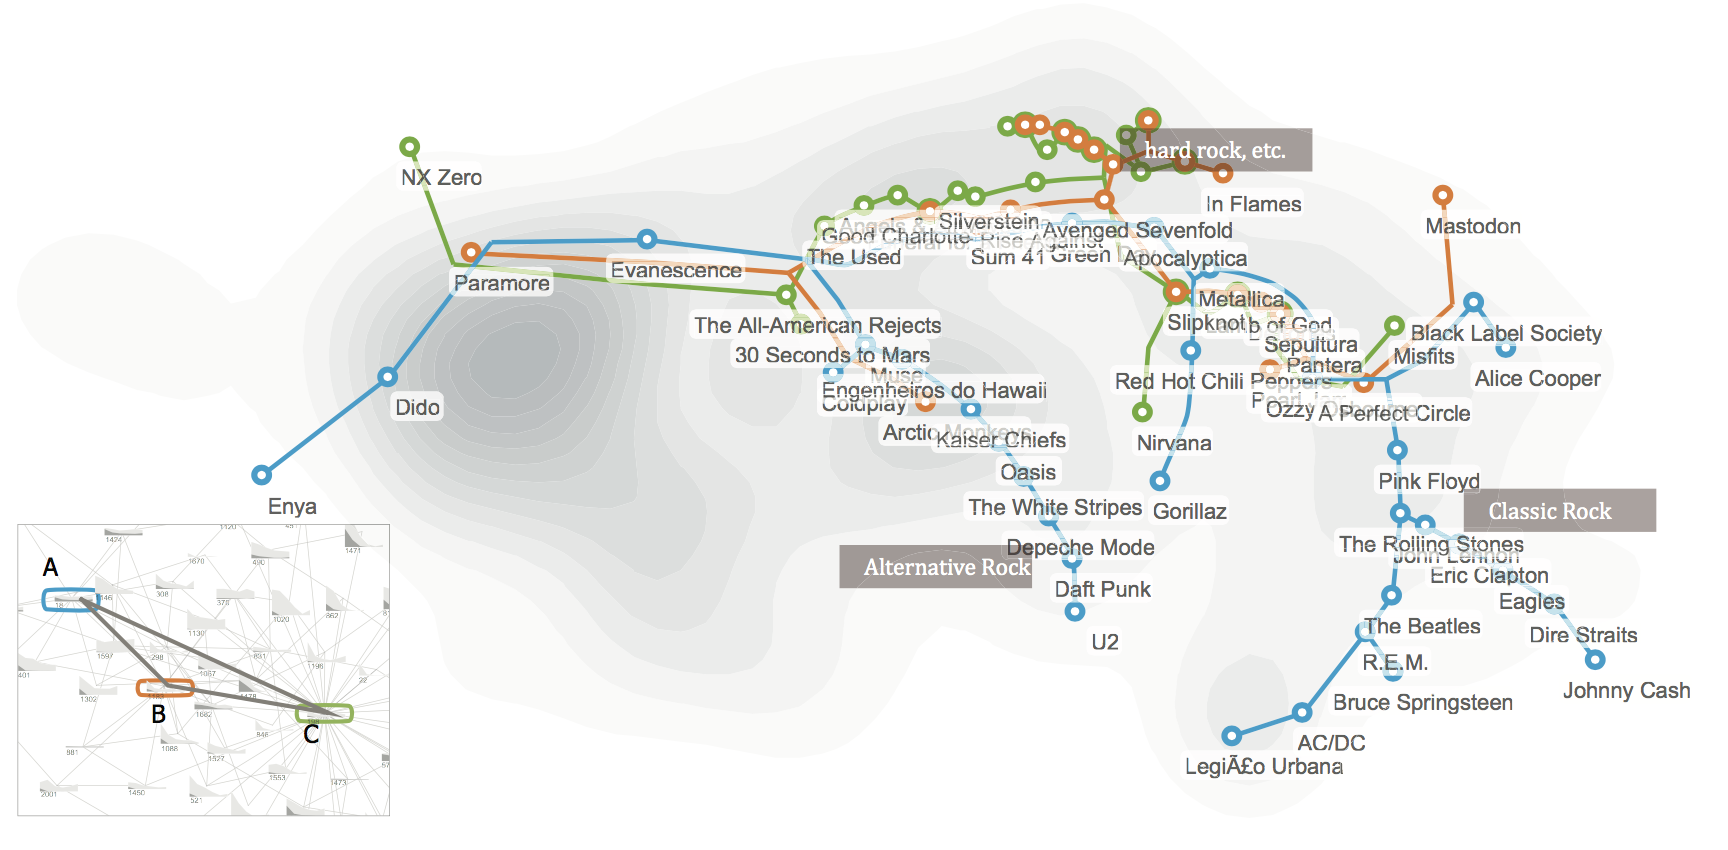
Many applications can be modeled as a graph with additional attributes attached to the nodes. For example, a graph can be used to model the relationship of people in a social media website or a bibliographical dataset. Meanwhile, additional information is often available, such as the topics people are interested in and the music they listen to. Based on this additional information, different set relationships may exist among people. Revealing the set relationships in a network can help people gain social insight and better understand their roles within a community. In this paper, we present a visualization system for exploring set relations in a graph. Our system is de- signed to reveal three different relationships simultaneously: the social relationship of people, the set relationship among people’s items of interest, and the similarity relationship of the items. We propose two novel visualization designs: a) a glyph-based visualization to reveal people’s set relationships in the context of their social networks; b) an integration of visual links and a contour map to show people and their items of interest which are clustered into different groups. The effectiveness of the designs has been demonstrated by the case studies on two repre- sentative datasets including one from a social music service website and another from an academic collaboration network.
